Open Specific Images from Folder
Program:
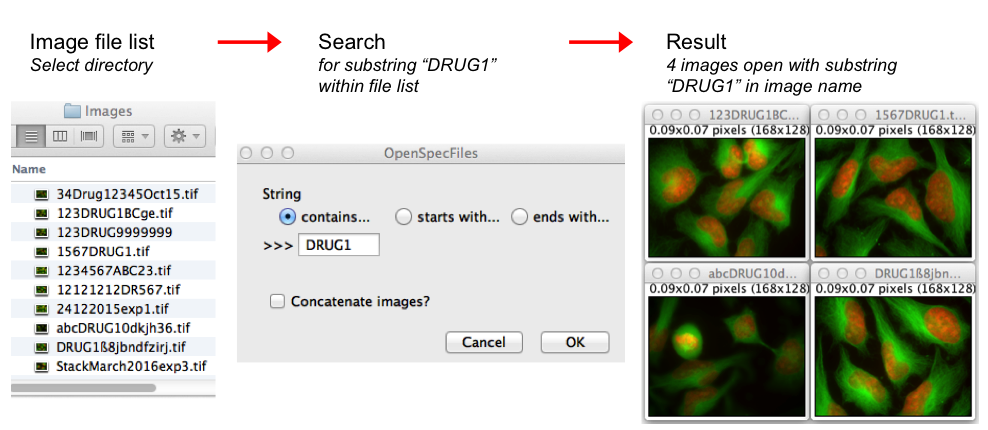
OpenSpecFiles
This macro opens files from a selected folder plus subfolders. It only opens those files containing a user-defined substring, i.e. a partial name or number. Files that either start or end with the substring, or files that have the substring anywhere within its full name can specifically be opened. If wanted, the open images can be concatenated to a stack.
 ROIExtractConcatenate
Program
ROIExtractConcatenate
Program:
ROI_ExtractConcatenate
Takes regions-of-interest (ROI) from an image series in order to extract and concatenate user-defined area selections for better object displays. The size of the area and the area shape (circular or square) can freely be chosen. The macro works with 8-, 16-, 32-bit images, RGB images and hyperstacks (i.e. composite images). For multi-channel hyperstacks, the user can choose whether to display specific channels, or all channels.
 Split Image and Concatenate
Program
Split Image and Concatenate
Program:
SplitImage_andConcatenate
This macro splits an image into user-defined smaller-size images and concatenates them into a stack. It works with 8-, 16-, 32-bit, RGB and composite images.
 Measuring peripheries
Program
Measuring peripheries
Program:
Nuclei_PeripheryMeasure
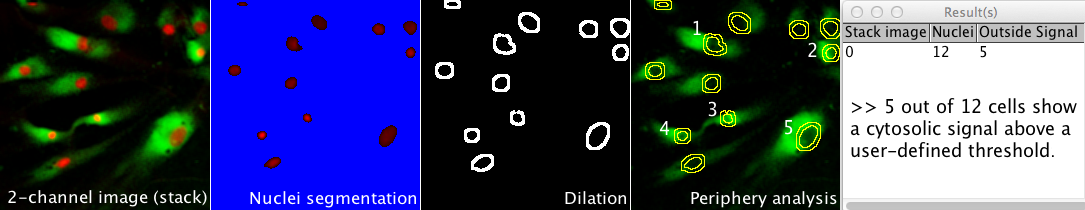
Counts the number of cells with a cytosolic signal above a user-defined threshold within a cell population. As output, the number of criteria-matching cell counts with respect to the total number of cells is provided. The macro works on images or image stacks with two channels. In short, the macro takes the nuclear signals in one channel as reference for individual cells. Segmentation of nuclei is done by intensity thresholding. The corresponding nuclear areas are registered and used to create binary images as masks. In order to measure the cytosolic signal of the second channel, dilations are performed on the binary images in a user-defined manner to take different cell shapes into consideration. The resulting mask images with intensity values 0 (background) and 1 (foreground) are multiplied with the images of the second channel to select the areas for measurement. For the analysis, the user can specify both a general signal intensity threshold and a minimal number of pixels required above that threshold for positive counts.
 Interactive design of spots with Gaussian intensities
Program
Interactive design of spots with Gaussian intensities
Program:
Gaussian_Synth
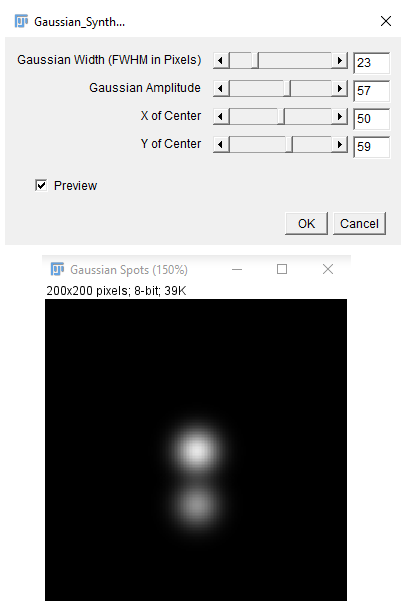
Synthesizes a spot with Gaussian intensity on an opened image. Four parameters of Center (X and Y), width, and the intensity of the Gaussian profile can be adjusted interactively. The synthesized image can be used again to synthesize other spots (by preserving previous ones). The starting point for this Java program was the program
Cross_Fader.java, written by Michael Schmid.
Installation: Simply download
this file and put it in the "Plugins" subfolder of your ImageJ (or Fiji) folder. Then, launch ImageJ (or Fiji) again.
 Partitioning cells
Program
Partitioning cells
Program:
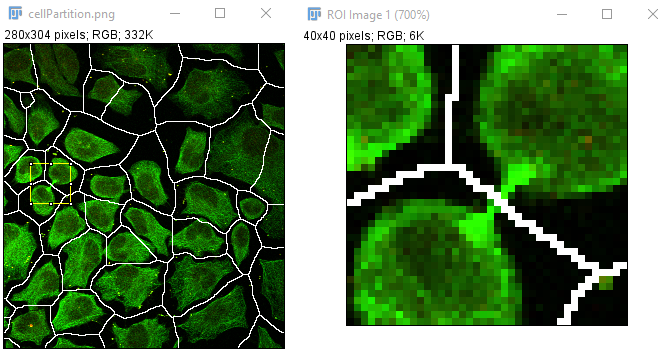
CellPartition
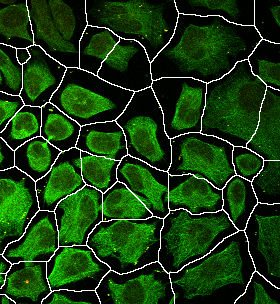
Works on a 2-channel image (or stack) and uses the information of nuclei (in the first channel) to estimate cell boundaries. The estimated cell boundaries will be added as a third channel to the composite image (or stack).
 Displaying Progress as Overlay
Program
Displaying Progress as Overlay
Program:
ProgressAsOverlay
Displays the action (to be performed) as an
overlay to inform the user. It is a more visible and less distracting alternative for the
ShowMessage windows and
showStatus messages.
Measurements over ROIs determined by mouse clicks
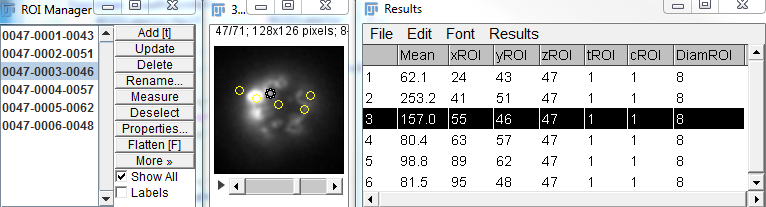
Program: ClickMeasure (
Macro and
Plugin)
Extends the functionality of the
Point Tool, by performing measurements on
finite-size ROIs (as opposed to points).
Note: It is recommended that the ROI list be saved by the user (
ROI Manager ➪ More ➪ Save). The automatically-saved ROI seems to work with stacks, but not hyperstacks.
 Interactive flow diagram
Program
Interactive flow diagram
Program:
FlowDiagram
Offers a menu by explicit demonstration of individual steps in the flow diagram. The user sees the entire flow diagram and gets information regarding each step (with a Mouse-over action). At the same time, he can decide which steps, with what orders, and on what data sets should be executed. Such a flexible and informative flow diagram is suited both for beginners and also for experienced users willing to perform customized operations or to modify intermediate results.
 Estimation of transport regime (of a tracked particle)
Program
Estimation of transport regime (of a tracked particle)
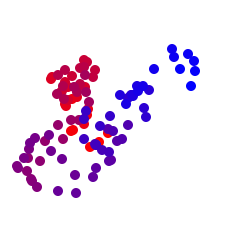
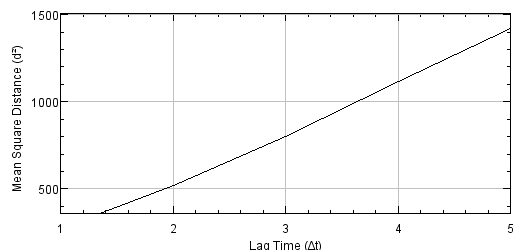
Program: TransportRegime (
Macro and
Plugin)
Plots the Mean Square Distance (MSD) vs. Lag Time of a given track. The curvature and the slope of this curve are important
signatures of the transport regime.
 Finding the separation of two spots
Program
Finding the separation of two spots
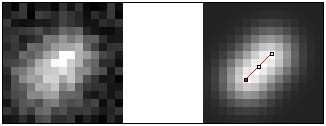
Program:
DoubleGaussianFit
Retrieves the distance between two
assumed spots by fitting a two-Gaussian function.
A priori knowledge about the sizes and (relative) intensities of the spots can be used to minimize the dimensionality of the problem. The measure of similarity is
Pearson's correlation coefficient.
 Overlap scenarios of two ROIs
Program
Overlap scenarios of two ROIs
Program:
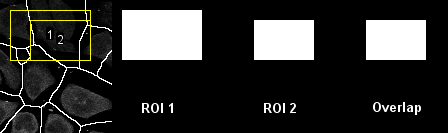
ROIOverlap
Determines if two ROIs are within each other, overlapping, or separated.
 Time-lapse pattern generator
Program
Time-lapse pattern generator
Program:
TrackGenerate
Helps by validation of tracking results. The program simulates time-lapse microscopy images of a particle along a gievn track. The size, the orientation, and the brightness of the particle can change over time. This code offers a convenient starting point to introduce more realistic changes to the particle, as studied in the
population context and
cell morphology.
 Visualization of multiple (synchronous) 1D plots
Program
Visualization of multiple (synchronous) 1D plots
Program:
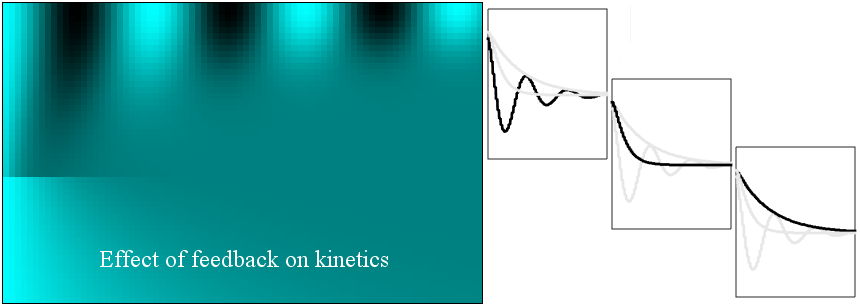
BrowsePlots
Loads and plots a set of measurement files together as a 2D image. Furthermore, by browsing the
ROI Manager, one can see individual 1D plots. The test dataset shows a series of kinetics profiles corresponding to a second-order system with different levels of feedback. This
classical control problem has found more
biological relevance recently.
 Flexible ROI Zoom-in
Program
Flexible ROI Zoom-in
Program: FlexibleZoomIn (
Macro and
Plugin)
Replaces the exhaustive iterations of {zoom-in, zoom-out} with auxilary zoomed-in image(s). By simply clicking at arbitrary points (ROI centers in the original image), a zoomed-in version of the ROI will show up as a different image. Such new ROI images can be closed automatically upon a new zoom-in action.
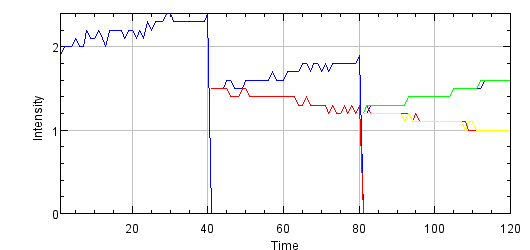
 Intensity Bifurcation Diagram (consecutive mitosis events)
Program
Intensity Bifurcation Diagram (consecutive mitosis events)
Program:
BifurcationDiagram
Tells an
evolutionary story of
mitosis by concatenating the (integrated) intensities of all tracked cells (involved in consecutive mitosis events).
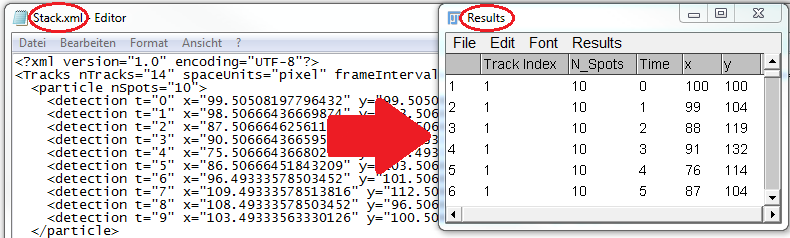
 Loading XML files (TrackMate outputs)
Program
Loading XML files (TrackMate outputs)
Program:
LoadXML
Loads the XML-formatted output of
TrackMate into the
Results Table.
 Normal random number generator for stochastic processes
Program
Normal random number generator for stochastic processes
Program:
normalRandom
Uses the available
uniform random number generator of ImageJ and
generates a corresponding sequence with
normal (Gaussian) histogram. Many applications of random numbers (as in tracking simulations) require random numbers with normal (or Gaussian) distribution.
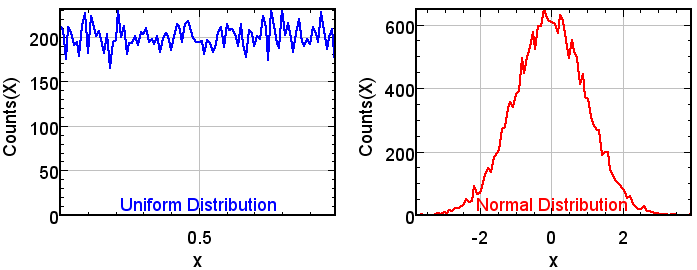 Table Tennis
Program
Table Tennis
Program:
TableTennis
Exemplifies the design of an interactive program (modified from
K.U. Barthel's version of the old pong game).