Below are examples of applying the program Map3-2D to z-stacks (left) to obtain the corresponding 2D Map (right).
Texture-based volume |
➪ |
2D Map projection |
Basic principle: A surface (embedded in a z-stack) is unfolded as a planar image. By doing so, the full surface content can be displayed at once.
 |
➪ |
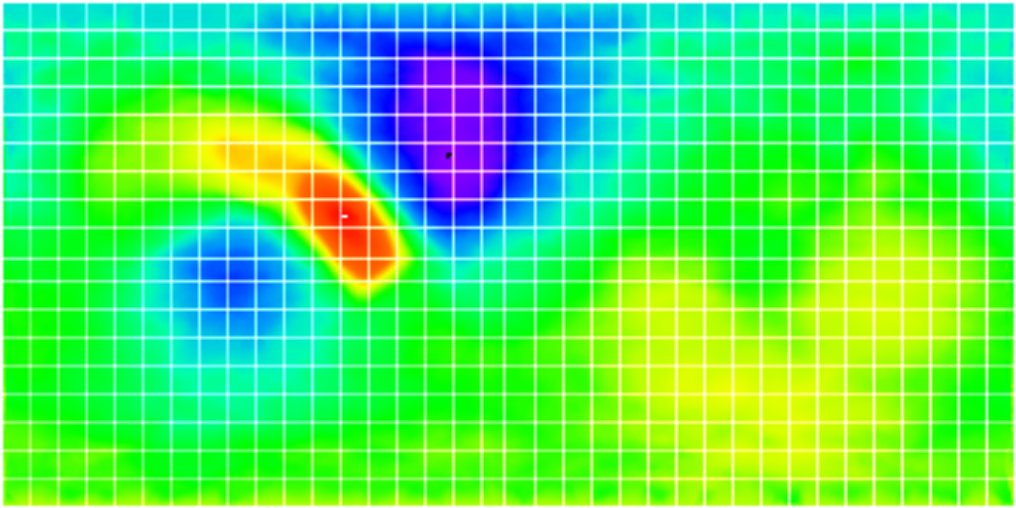 |
Shape display of uneven surfaces with map projections. Deviations of a mammalian nucleus surface (indentations in blue, protrusions in red) from a reference ellipsoid (white) are displayed by color-coding.
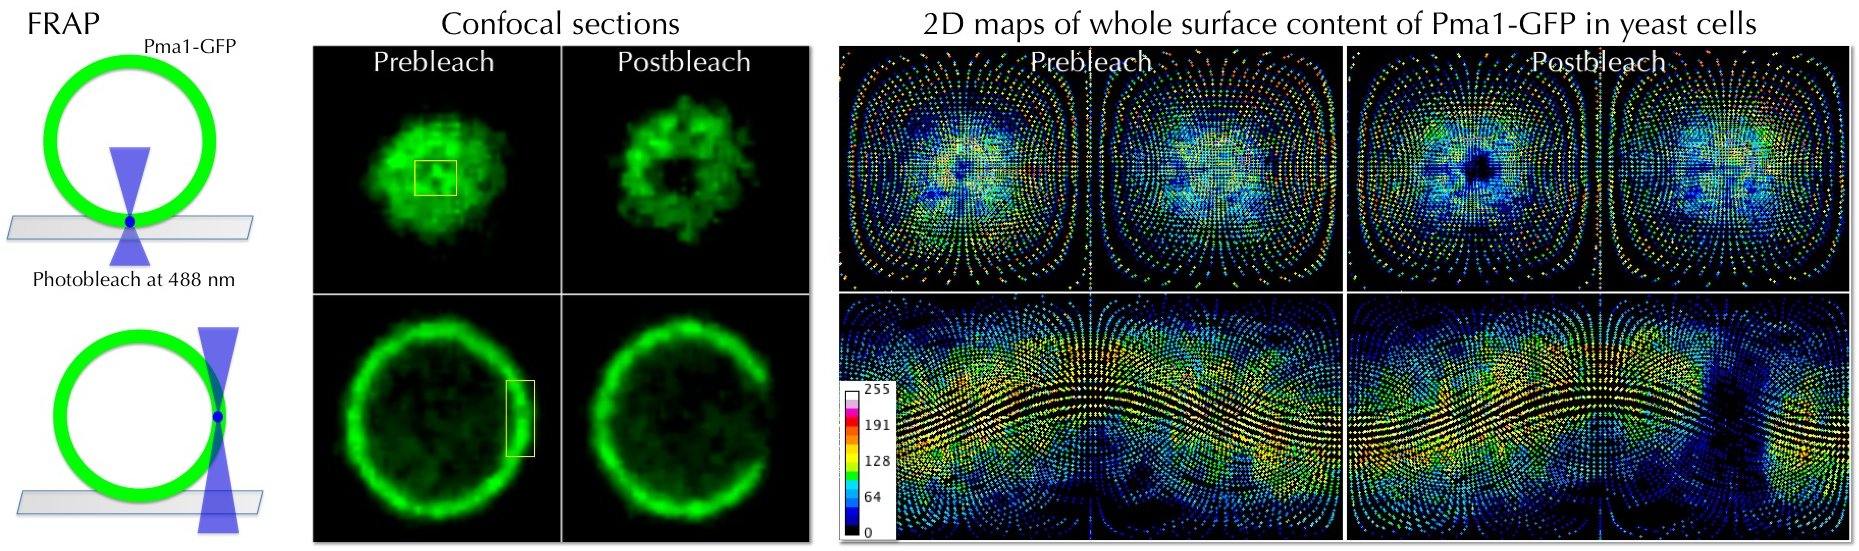 |
Quantitative measurements over time on 2D maps. S.cerevisiae cells expressing Pma1-GFP were subjected to fluorescence recorvery after photobleaching (FRAP). Pre- and postbleach confocal sections (left) and 2D maps (right) are shown.
Yeast cells kindly provided by Dr. Wendelin Wolf.
2D map projections for visualization and quantitative analysis of 3D fluorescence micrographs
G. Hernán Sendra, Christian H. Hoerth, Christian Wunder and Holger Lorenz
Scientific Reports 5, 12457 (2015), doi:10.1038/srep12457