|
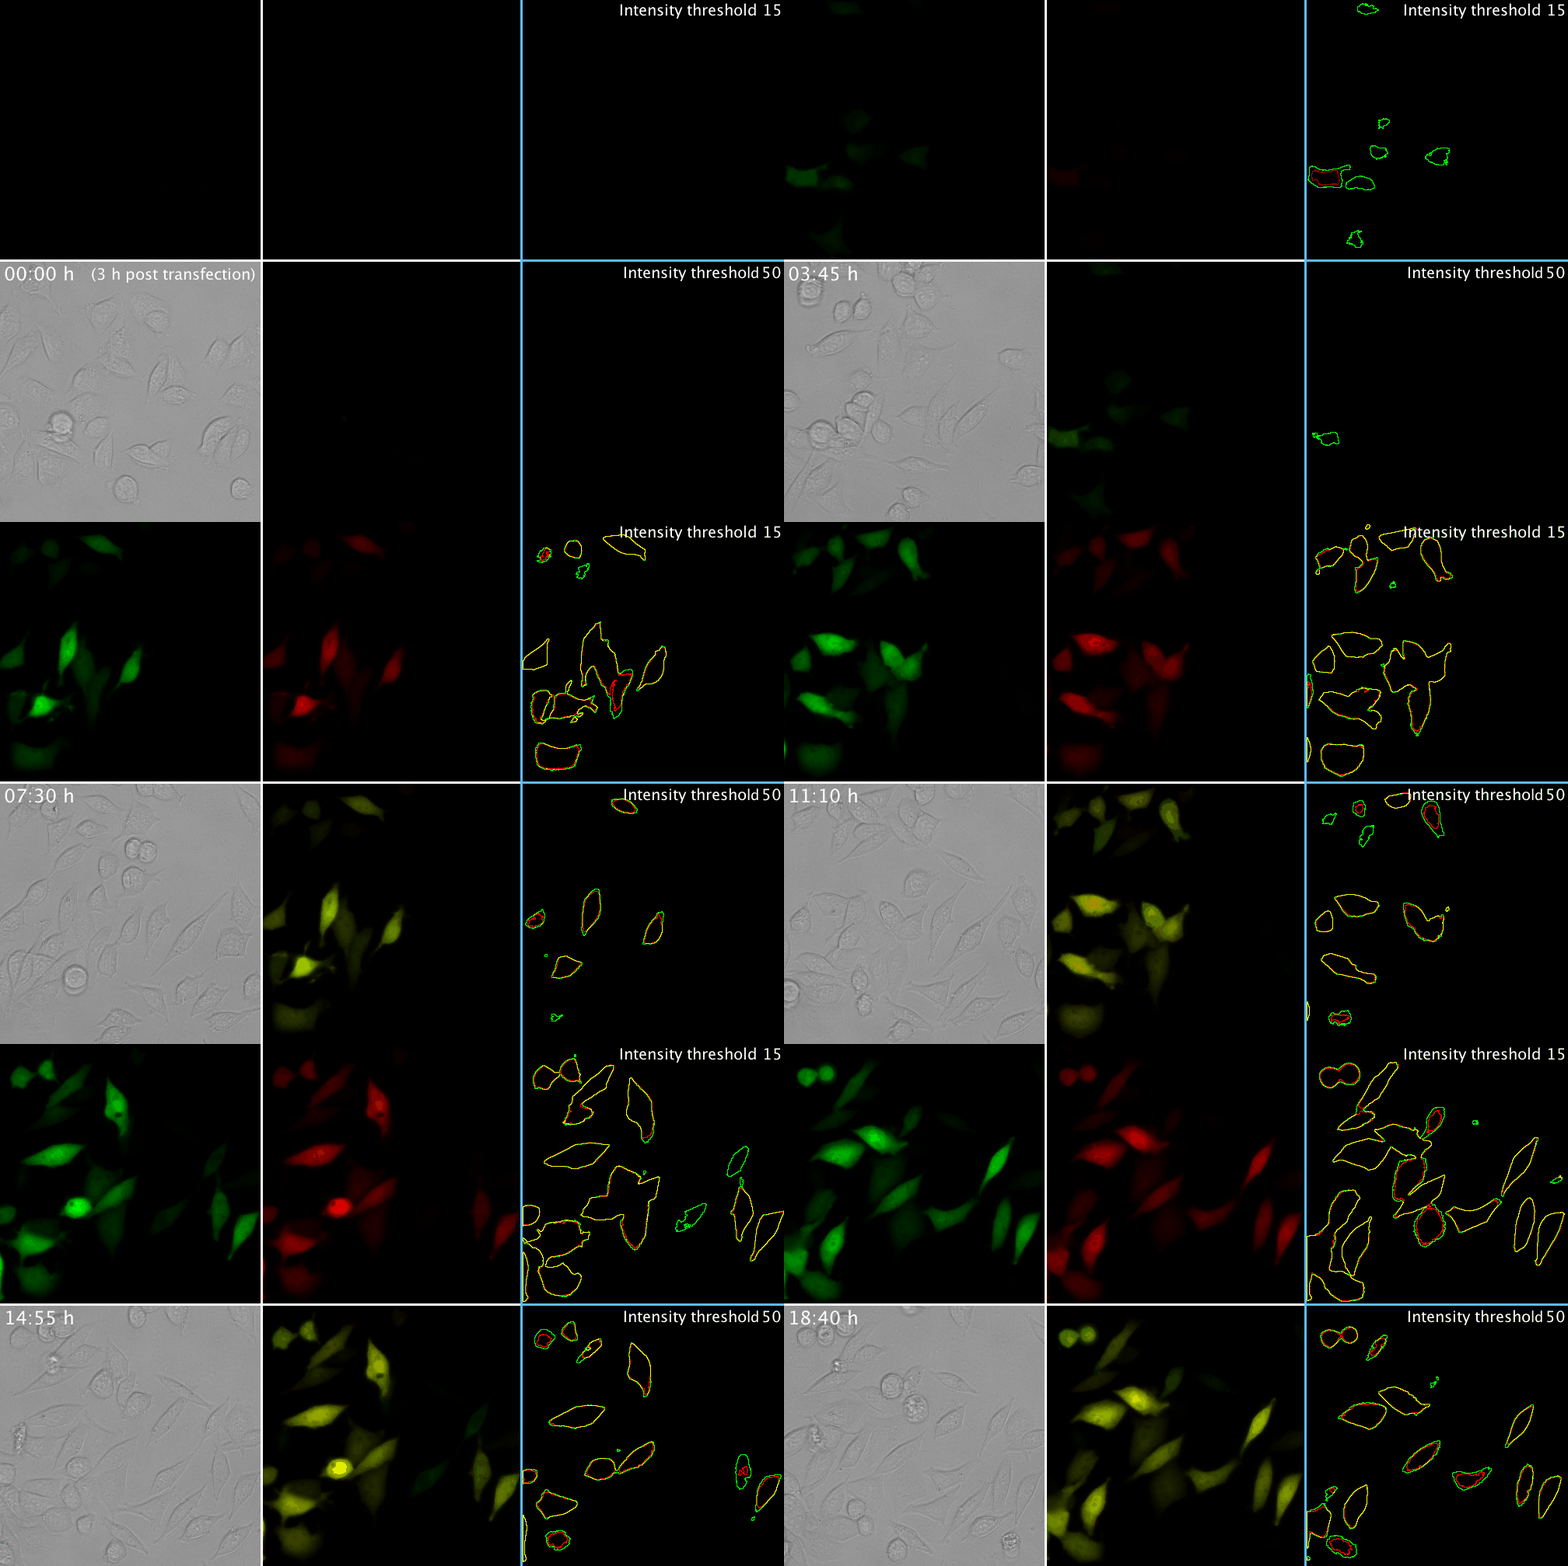
Movie 1. Tandem fluorescent protein timer in mammalian cells:

Movie 1. Transient transfection of mammalian cells with the tandem timer construct. The sfGFP (top left) and mCherry (top middle) signals are shown individually, and as overlay (bottom middle). The time course upon transfection is indicated on top of the corresponding brightfield images (bottom left). For better comparison both the sfGFP and mCherry intensities were 8bit-histogram-matched and intensity thresholds 15 (top right) and 50 (bottom right) were applied to see the appearance of the sfGFP (in green) and mCherry (in red) intensities above the threshold outlined. By doing so, the appearance of the fast-maturing sfGFP signal prior the appearance of the slower-maturing mCherry signal (1 h delay, approx.) can clearly be seen.
Movie 2. Visualization of protein aggregation by using an aggregation-prone protein fused with the tandem timer:

Movie 2. Expression of an aggregation-prone protein-tandem timer fusion in mammalian cells. Image processing and setup similar to Movie 1. By using the tandem timer approach, it can be shown that freshly made proteins immediately undergo aggregation and do not age in the cytosol before they are sequestered into inclusion bodies. Especially with the intensity threshold set to 200 (bottom right), it can clearly be seen that the aggregates were only green in the beginning, which indicates freshly synthesized (and not old) protein. This kind of analysis is complicated to achieve with conventional single-fluorescent protein fusion approaches.
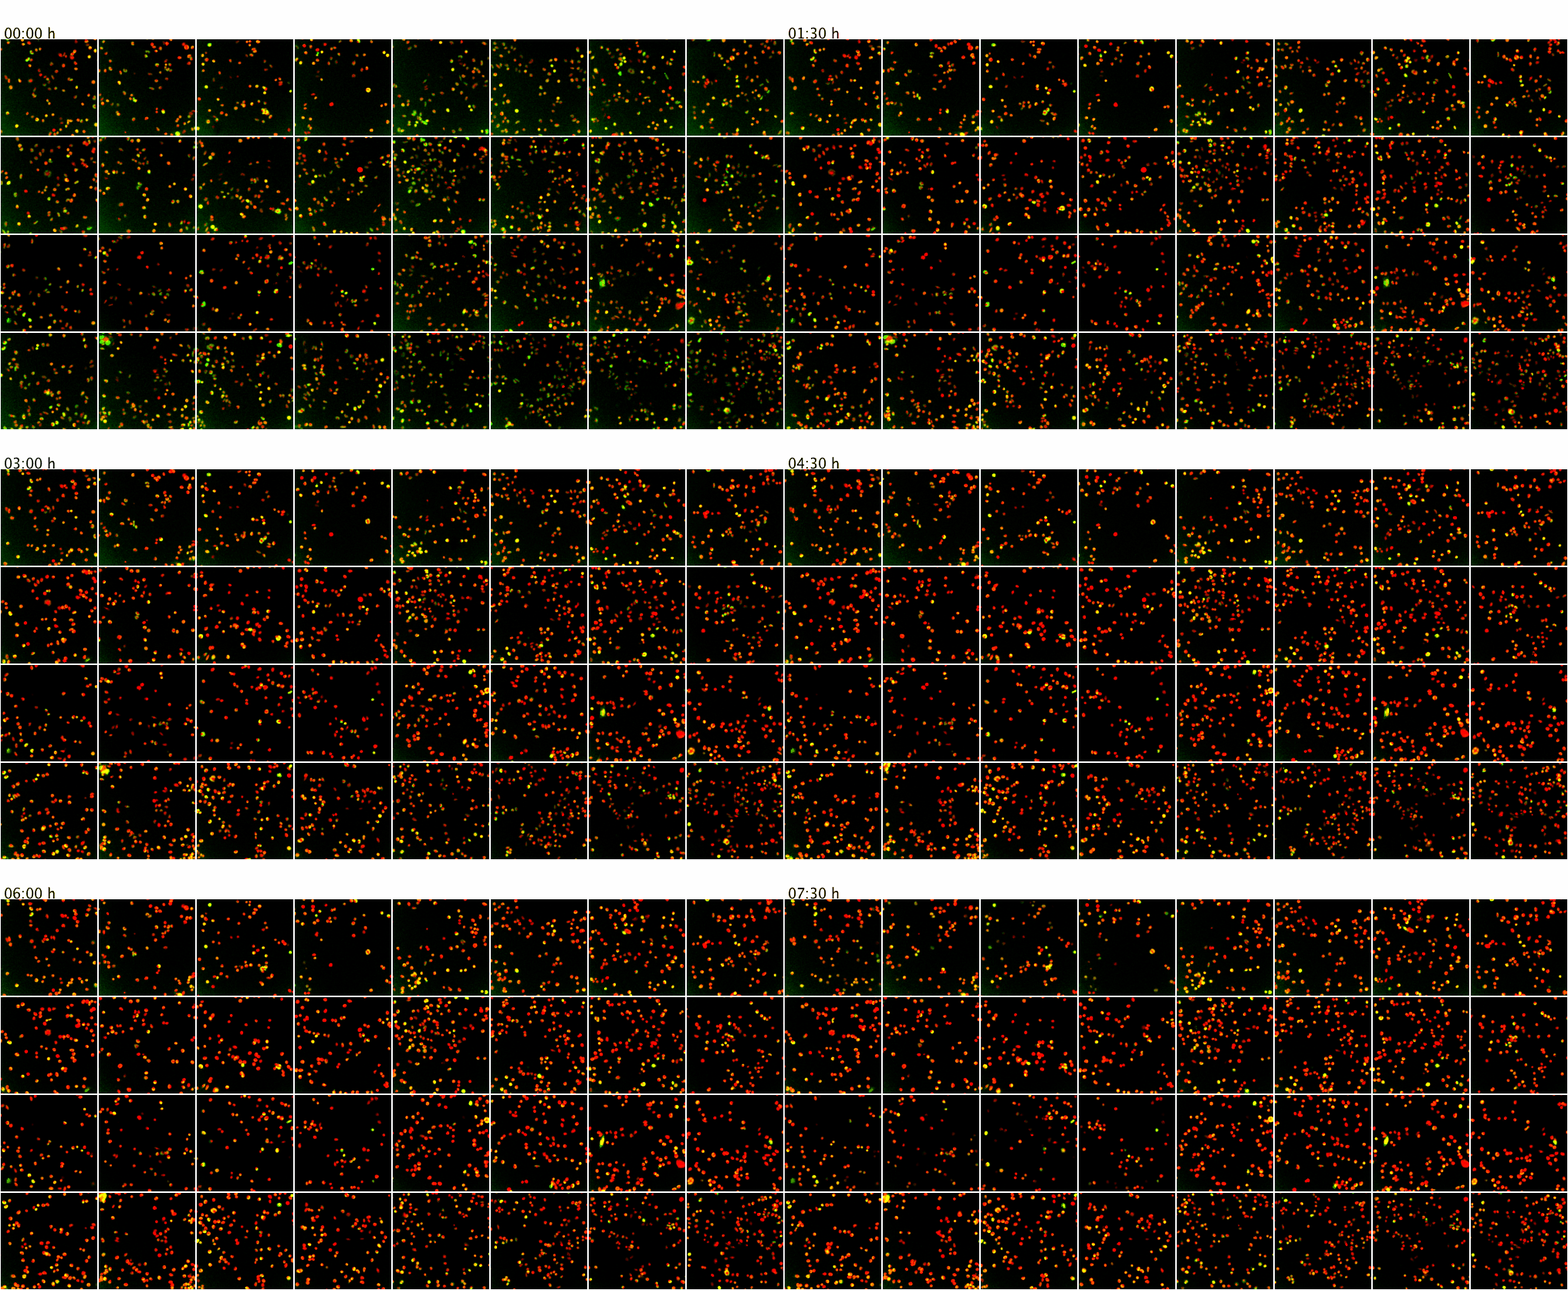
Movie 3. Screening microscopy of live mammalian cells:

Movie 3. Higher-throughput microscopy with the ScanR system of the ZMBH Imaging Facility. The ScanR microscope can be used for screening applications of fixed and live cells (up to 384-well format). Here, as proof of principle, live mammalian cells co-expressing GFP (green) and mCherry (red) fusion proteins were imaged over 7.5 h at 37 degreesC. Z-stacks from 4 positions per well of an 8-well chamber (a total of 32 XY positions) were screened over time with a 20x objective without loosing positions or focus. Maximum intensity projections of the Z-stacks are shown.
Movie 4. Screening microscopy of live mammalian cells:
Movie 4. Time-lapse pattern of mammalian cells: The green channel has been obtained by performing Maximum Intensity Projection (over 8 z slices of a 4D stack). The blue channel shows the background- and autofluorescence-suppressed image and is obtained with a 3-class Weka segmentation (background, autofluorescence, signal).
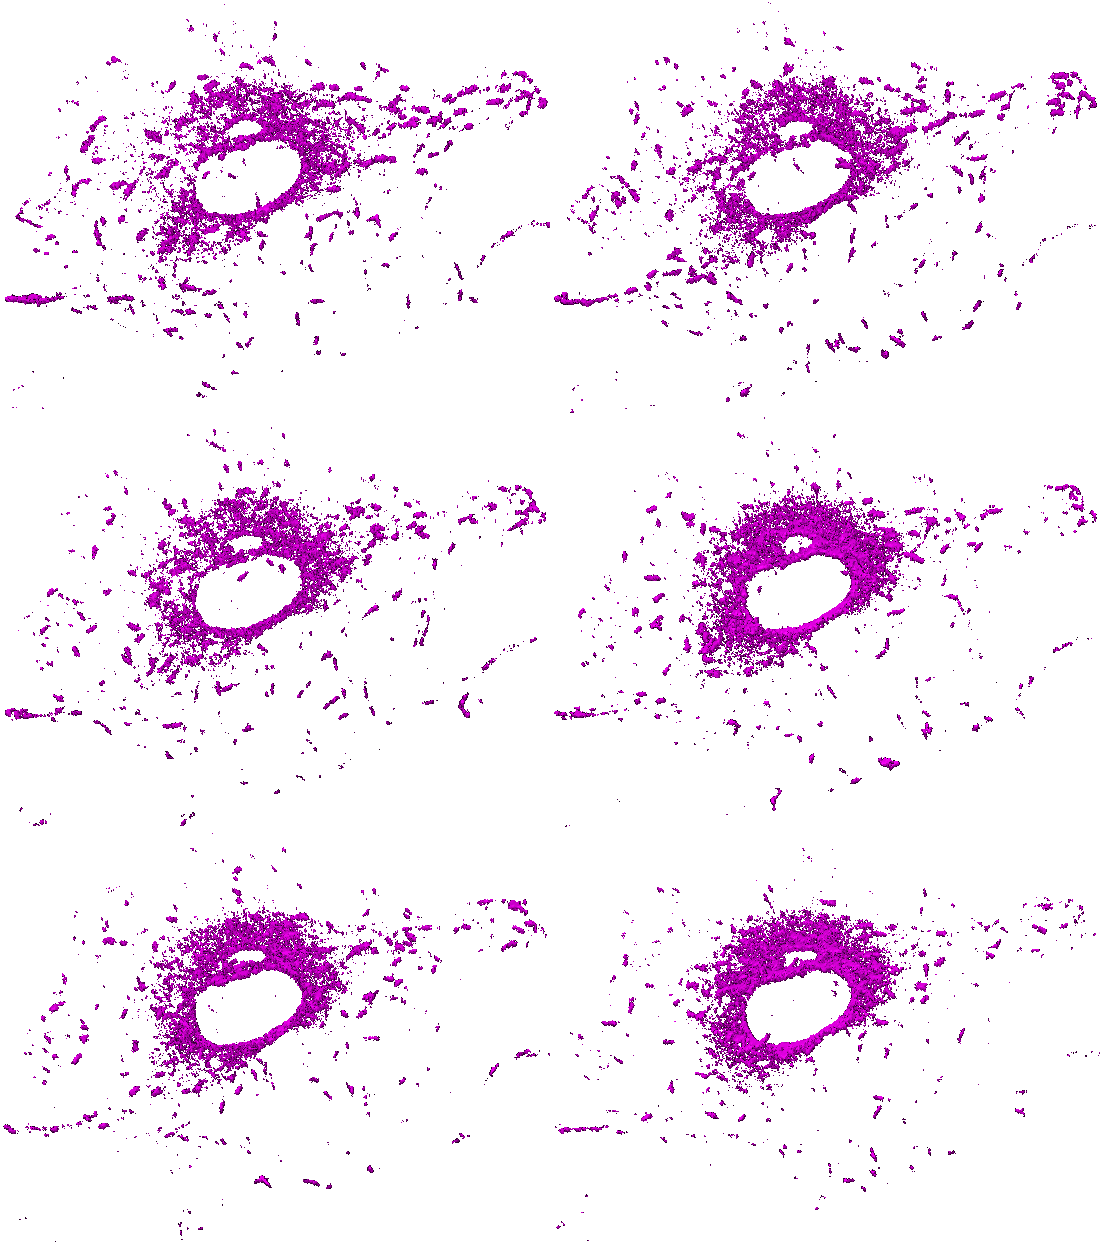
Movie 5. 4D visualization of microtubule dynamics (3D + Kinetics)

Movie 5. Time-lapse pattern of (3D) mammalian cells: One channel of a 5D hyperstack has been first converted to an X-Y-T time-lapse stack by performing Maximum Intensity Projection (over 5 z slices). The background and autofluorescence signals in this X-Y-T stack have been suppressed using a 3-class Weka segmentation (background, autofluorescence, signal). The output probability map of microtubules has been used as a gray-scale (non-binary) mask with all corresponding z slices (for a given X, Y, T). The resulting X-Y-Z-T hyperstack has been visualized (surface rendering) with ImageJ 3D Viewer. |
||
|
|